Survey Members
Daniel Gruen*, Jamie McCullough*, Alexandra Amon, Gary Bernstein, Jan Luca van den Busch, Rebecca Canning, Francisco Castander, Joseph DeRose, William Hartley, Hendrik Hildebrandt, Konrad Kuijken, Jochen Liske, Daniel Masters, Ramon Miquel, Andrea Pocino Yuste, Aaron Roodman, Roberto Saglia, Daniel Stern, Angus H. Wright * Contact: daniel.gruen@lmu.de and jmccull@stanford.edu
Synopsis
Accurate knowledge of the redshift distributions of faint samples of galaxies selected by broad-band photometry is a prerequisite for future weak lensing experiments to deliver precision tests of our cosmological model. The most efficient and accurate way to measure these redshift distributions is spectroscopic follow-up of galaxies selected to systematically cover a space defined by apparent colours in which there is little variation in redshift at any point. 4C3R2 will observe over 100,000 galaxies selected by their KiDS-VIKING ugriZYJHKs photometry over the identical footprint as the WAVES survey to constrain the colour-redshift relation with high multiplicity across two-thirds of the colour space of future Euclid and Rubin samples
Scientific context: The colour-redshift relation for weak lensing surveys
Photometric surveys can probe our cosmological model via the apparent distortion of galaxy shapes caused by the large-scale structure along their line of sight, so-called weak gravitational lensing. Despite the matter distribution, whose statistics are a consequence of the properties of the elusive dark matter, dark energy, and massive neutrinos, the strength of the distortion also depends on the distances to the lensed galaxies. Current samples of spectroscopic redshifts allow for a calibration of galaxy distances that is scarcely sufficient for the ongoing lensing experiments (Hildebrandt et al. 2021; Myles et al. 2021; Rau et al. 2022), but the next generation of surveys by Euclid, the Vera Rubin Observatory, and Nancy Grace Roman Space Telescope will be severely limited in testing cosmological models unless large, systematically selected and highly complete spectroscopic samples can be obtained.
Complete calibration of the colour-redshift relation
Direct calibration of redshift distributions effectively means making a histogram of the spectroscopic redshifts representative of a sample of galaxies. With current instruments this is prohibitively exposure time intensive for weak lensing source galaxy samples. This is not just because the galaxies in these samples are faint and thus their spectroscopic redshifts difficult to acquire, but also dependent on visibility of colour dependent spectral features. In addition, the large variation in the redshifts of galaxies
selected from noisy, few-broad-band photometry means (i) that incompleteness can strongly bias the sample if the success of a spectroscopic observation depends on the redshift of a targeted galaxy (e.g.Gruen & Brimioulle 2016), and (ii) that a large number of randomly sampled spectroscopic redshifts is required to achieve a sufficiently small statistical error (e.g. Newman & Gruen 2022, their section 3.3).
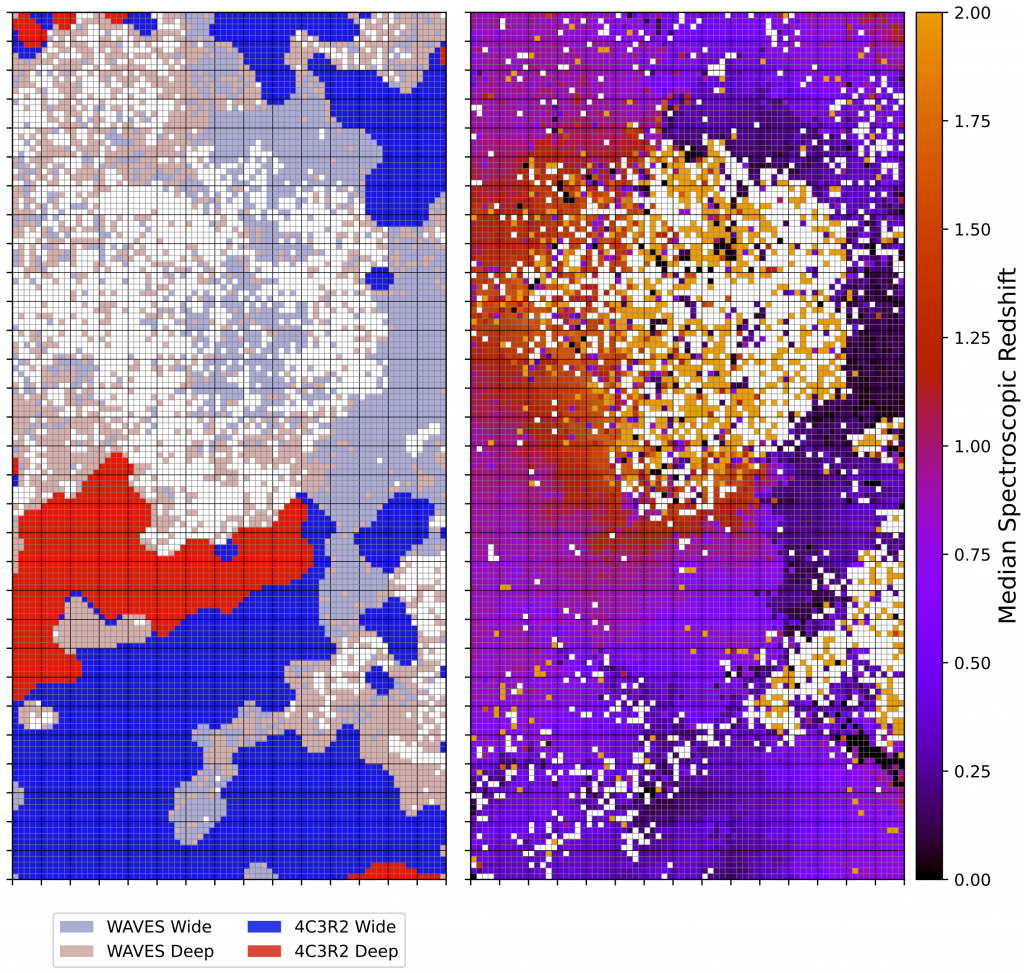
A much more efficient strategy is to bin galaxies by colour in a set of bands such that in each bin there is little scatter in redshift and little evolution of redshift with apparent magnitude. A technique that has been used for this extensively in the literature are so-called self-organizing maps (SOMs). These are few-dimensional grids of colour values contiguously embedded into the high-dimensional space of observed galaxy colours in such a way that each galaxy can be assigned to a grid cell with small colour separation. Figure 1 shows the SOM of Masters et al. (2015). By appropriately sampling each bin, i.e. each cell of the map, relatively few spectroscopic observations of relatively bright galaxies constrain the relation of colour to redshift. For surveys observing a different set of photometric bands, or observing at higher noise levels, any selection of galaxies can still be expressed as a linear combination of SOM cells, and thus its redshift calibration related to the SOM’s colour-redshift relation. This has motivated a set of optical and near-infrared spectroscopic surveys to sparsely cover the cells of this particular SOM (Masters et al. 2017, 2019; Guglielmo et al. 2020), in addition to survey data from the Dark Energy Spectroscopic Instrument (McCullough et al. 2023). The right panel of Figure 1 shows the state of spectroscopically calibrating the median redshift across this SOM. The resolution of this map is limited by photometric error in the observing survey, as galaxies can scatter asymmetrically between neighbouring cells.
Specific scientific goals: Densely probe galaxy colour space with 4MOST spectra
Approximately two-thirds of the colour bins defined by C3R2 (Masters et al. 2015) contain galaxies bright enough to achieve high redshift completeness with 4MOST spectroscopy of feasible exposure time. Unlike many of the deep, sparse surveys performed so far, 4MOST offers the unique possibility to achieve high multiplicity in each of these cells: to probe the full distribution of redshift given colour, and to accurately test and calibrate the dependence of redshift on magnitude at fixed colour. The resulting sample will form the broad basis for a wedding-cake C3R2 strategy that continues to require 8m-class and/or infrared spectroscopy for the parts of colour and magnitude space inaccessible to 4MOST.
Target selection and survey area: Synergies with KiDS-VIKING and WAVES
KiDS-VIKING ugriZYJHKs photometry provides the basis for selecting targets across colour space. 4C3R2 does this from the same photometric catalogue and over the identical area as the WAVES survey, spanning more than 1170 square degrees (Driver et al. 2019). Unlike the high completeness strategy of WAVES, 4C3R2 requests only a small subset of the potential targets. This allows for flexible fiber assignment and a high degree of synergy, which the two surveys are currently optimizing through joint simulations. The left panel of Figure 1 depicts the preliminary colour selection of 4C3R2 targets for both the wide and deep surveys. Colour cells that also contain WAVES targets, estimated according to existing photometric redshifts, are partly transparent. While 4C3R2 and WAVES contain overlapping targets, 4C3R2 purposefully does not select from areas in the map where WAVES Is expected to be complete, for example the low redshift (z < 0.2) filament depicted on the right side of Figure 1. This results in a complementary proposal of acquiring redshifts that are representative (4C3R2) by colour and magnitude when they cannot be complete (WAVES) for as much of the physical manifold of colour and redshift as possible.
Acknowledgements
This work was funded by the Deutsche Forschungsgemeinschaft (DFG, German Research Foundation) under Germany’s Excellence Strategy – EXC-2094 – 390783311. DG and JM acknowledge support by the Bavaria California Technology Center (BaCaTeC).
References
Driver, S. P. et al. 2019, The Messenger, 175, 46-49
Gruen, D. & Brimioulle, F. 2017, MNRAS, 468, 1, 769-782
Guglielmo, V. et al. 2020, A&A, 642, A192
Hildebrandt, H. et al. 2021, A&A, 647, A124
Masters, D. et al. 2015, ApJ, 813, 1, 53
Masters, D. et al. 2017, ApJ, 841, 2, 111
Masters, D. et al. 2019, ApJ, 877, 2, 81
McCullough, J. et al. 2023, arXiv e-prints
Myles, J. et al. 2021, MNRAS, 505, 3, 4249-4277
Newman, J. & Gruen, D. 2022, ARAA, 60, 363-414
Rau, M. M. et al. 2022, arXiv: 2211.16516